")
")
Long-read RNA-seq mapping - very close competition between GMAP and Minimap2
by Krešimir Križanović
Recently, our paper on RNA mappers for 3rd generation sequencing data has been published by Bioinformatics (https://doi.org/10.1093/bioinformatics/btx668). During the work on the paper, Minimap2 (https://github.com/lh3/minimap2) did not have support for RNA mapping and there was not enough time to include it in the tests during the revision process. Recently, we have run Minimap2 on our test dataset and the results (compared to other RNA mapping tools that we tested in our paper) are given in the tables below.
Full results for all tested mappers, the details on the used tools, datasets and metrics can be found in the paper (link above) and in the GitHub repository for the tools that we developed for the evaluation (https://github.com/kkrizanovic/RNAseqEval). All real and simulated datasets, as well as all of the data used for dataset simulation can be found at FigShare (https://figshare.com/projects/RNAseq_benchmark/24391).
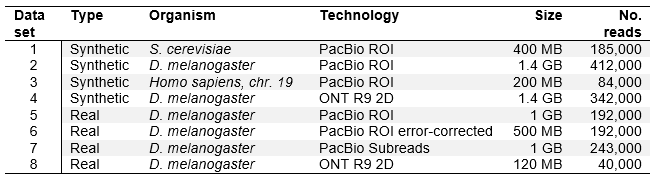
Our test datasets include 4 simulated and 4 real datasets of varying complexity. The details are given in the table below. In our evaluation, we used different metrics for synthetic and for real datasets. For synthetic datasets, origin of each simulated read is precisely known (generated by the simulator). Therefore, it is possible to precisely evaluate mapping precision for each read. Three simulated datasets were simulated with the same error profile (for PacBio ROI), while one was simulated with ONT MinION error profile. For real datasets, read origins are unknown, and mapping is evaluated by comparing it to the set of annotations. We cannot determine with certainty if a read is mapped correctly, we can only check if it overlaps an exon or several exons in a series, corresponding to an annotation. All real datasets we obtained from the same organism, but have different error profiles, due to different technologies, error correction or read type.
Table 1. Test datasets.
The results show Minimap2 achieves very good results for all datasets, similar to GMAP (usually within few percent), the mapper that proved the best in our tests for the paper. It maps more reads than other mappers on all simulated and real datasets (row Aligned), or at least it reports the most reads as mapped.
The results on first three simulated datasets (PacBio ROI error profile) show that Minimap2 is always the best at mapping to at least one exon of the read origin. On datasets one and two (less complex, having less reads generated from more than one exon), Minimap2 also maps reads the best to all exons from their origin. On the most complex dataset three, GMAP is ahead in “hitting” all exons. Except on the least complex dataset one, Minimap2 falls behind GMAP at correctly mapping (within 5 bases) to the beginning, end and all exon boundaries of the read origin. Simulated dataset four was simulated using ONT MinION error profile and GMAP and Minimap2 show very similar results on all measures.
The results on real datasets are also very close between GMAP and Minimap2. On higher error rates, datasets three and four (PacBio subreads and ONT MinION 2D reads), Minimap2 is clearly better on all criteria. However, on lower error rates, datasets one and two (PacBio ROI and error-corrected PacBio ROI) Minimap2 reports more reads as mapped and is still better at hitting an exon from an annotation file. However, GMAP shows better results at mapping to a contiguous set of exons from an annotation file.
To summarize, the results achieved by Minimap2 are very good and very close to GMAP. It can be speculated that Minimap2 handles higher error rates better and is better at mapping to a general read origin. However, GMAP is slightly better at mapping to a precise read origin, especially at lower error rates. This hypothesis would, of course, have to be tested further, to be confirmed.
Table 2 (Modified table 3 in the paper). Evaluation on synthetic datasets.
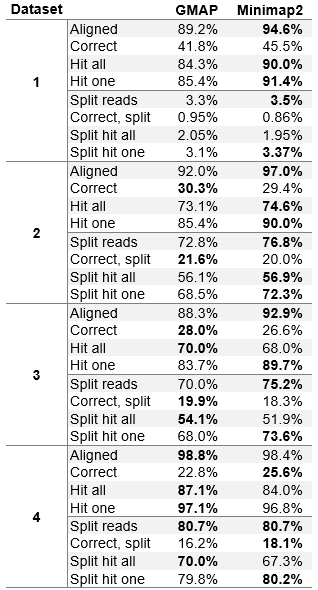
All results are displayed as the percentage of all reads in the dataset. The percentages of reads that were aligned is shown (without assessing the accuracy), percentage of reads for which the beginning, the end and inner exon boundaries are accurately placed within 5 base-pairs (Correct), percentage of reads that overlap all exons of the read origin (Hit all) and percentage of reads that overlap at least one exon of the read origin (Hit one). Overlaps of hit one and hit all statistics need to be at least 5 bases.
Table 3 (Modified table 4 in the paper). Aligner evaluation on real datasets.
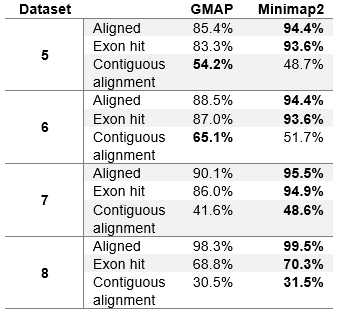
The table shows percentage of reads that were aligned (without assessing the accuracy), percentage of reads that overlap at least one exon (exon hit) and percentage of reads that overlap one or more exons in a sequence, corresponding to a gene annotation (contiguous exon alignment). All values are displayed as the percentage of all reads in the dataset. Overlaps for exon hit statistics need to be at least 5 bases.
In our initial tests we didn’t consider whether a read represents a genuine part of an RNA, or is a sequencing artefact. Our only concern was whether an aligner was able to map a read to a location that we considered accurate. Due to quite busy schedule and holidays, we finally found some time to do some additional testing.
Minimap2 reports a significant number of reads in each real dataset as chimeric. This information was not provided by other aligners (with the parameters that we initially used). To better asses how GMAP compares to Minimap2 on genuine reads, we have removed all reads reported as chimeric from each real test dataset, and run our evaluation again. The results are shown in table 4. We have also rerun GMAP on real datasets with different parameters to see how many reads it reports as chimeric. The number of reads each aligner reports as chimeric is given in table 5.
Table 4 (Modified table 4 in the paper). Aligner evaluation on real datasets without chimeric reads.

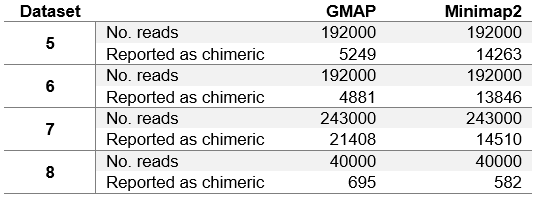
Table 5. Number of reads reported as chimeric.
We can see that the results in table 4 differ from table 3 only slightly. Minimap2 in general achieves few fractions of a percent worse results than in table 3. This is due to the fact that Minimap2 was able to map all chimeric reads (Minimap2 was used to determine chimeric reads). GMAP, on the other hand, achieves slightly better results on dataset 1, while slightly worse results on other datasets. It can be concluded that GMAP was able to map fewer chimeric reads on dataset 1, and with excluding those reads from the dataset, GMAPs results improved. On other datasets GMAP was able to map almost all chimeric reads (close to Minimap2), and with excluding those reads from the datasets, GMAPs results worsened.
In table 5 we can see that in general PacBio datasets (5, 6 and 7) contain significantly more chimeric reads than ONT MinION dataset. This is due to the fact that PacBio sequencing instruments produce more artefacts. It is also interesting to note that GMAP reports chimeric reads somewhat inconsistently, with relatively few on ROI and corrected ROI datasets (datasets 5 and 6 respectively), and with much more on the subreads dataset (dataset 7).